Article Text

Abstract
Objectives Rapid sequence intubation (RSI) is the standard for definitive airway management in emergency medicine. In a video-based study of RSI in a paediatric emergency department (ED), we reported a high degree of process variation and frequent adverse effects, including oxyhaemoglobin desaturation (SpO2<90%). This report describes a multidisciplinary initiative to improve the performance and safety of RSI in a paediatric ED.
Methods We conducted a local improvement initiative in a high-volume academic paediatric ED. We simultaneously tested: (1) an RSI checklist, (2) a pilot/copilot model for checklist execution, (3) the use of a video laryngoscope and (4) the restriction of laryngoscopy to specific providers. Data were collected primarily by video review during the testing period and the historical period (2009–2010, baseline). We generated statistical process control charts (G-charts) to measure change in the performance of six key processes, attempt failure and the occurrence of oxyhaemoglobin desaturation during RSI. We iteratively revised the four interventions through multiple plan-do-study-act cycles within the Model for Improvement.
Results There were 75 cases of RSI during the testing period (July 2012–September 2013). Special cause variation occurred on the G-charts for three of six key processes, attempt failure and desaturation, indicating significant improvement. The frequency of desaturation was 50% lower in the testing period than the historical (16% vs 33%). When all six key processes were performed, only 6% of patients experienced desaturation.
Conclusions Following the simultaneous introduction of four interventions in a paediatric ED, RSI was performed more reliably, successfully and safely.
- Checklists
- Emergency department
- Quality improvement
- Paediatrics
Statistics from Altmetric.com
Introduction
Rapid sequence intubation (RSI) is the most common, complex procedure performed in a paediatric emergency department (ED),1–3 and is the standard for definitive airway management. As spontaneous respiration ceases during RSI, critically ill or injured patients are at risk for physiological deterioration, in particular, hypoxaemia. Profound or prolonged hypoxaemia, measured clinically as oxyhaemoglobin desaturation, may lead to neurological injury4–9 and increase the risk of mortality.10–12
We recently reported a higher frequency of desaturation during RSI in a paediatric ED than previously described.13 Using video review, we found surprising variation in the performance of RSI, from errors in medication selection to frequent, prolonged laryngoscopy attempts. Desaturation occurred for 33% of patients; the median number of patients between those with desaturation was one. Nearly one in five patients had multiple episodes of desaturation during RSI, and two patients developed cardiac arrest.
Motivated by these findings, we conducted a quality improvement initiative to improve the safety of RSI in our ED. The objective of the initiative was to reduce variation in the performance of RSI and, thereby, improving procedure-related safety. Our specific aim was to increase the median number of patients between those with desaturation.
Methods
Ethical considerations
Prior to initiation of the project, our institutional review board evaluated our proposal and determined it was not human-subjects research, based on federal regulations and our institutional guideline. The use of video recording has been an integral aspect of divisional quality assurance and peer review activities for more than a decade, and consent for use of video recordings for these purposes is included in our general ED consent for treatment.
Setting
The setting was our institution's paediatric ED (∼70 000 annual visits), where RSI is performed in a dedicated resuscitation area. Resuscitation-area patients are managed by multidisciplinary teams led by a paediatric emergency medicine (PEM) physician. Before the project began, the PEM physician team leader was responsible for both patient management and procedural supervision. Laryngoscopy attempts were performed by residents, fellows or faculty physicians. Anaesthesiologists were responsible for the airway management of trauma patients, and were, otherwise, available as needed.
Planning the interventions
Improvement team
In the spring of 2012, a multidisciplinary improvement team was convened consisting of physicians, respiratory therapists and nurses from the ED, a research coordinator and an analyst. The ED medical director served as project champion, and contributed to regular communications with ED staff. This team was integrated into our divisional and institutional infrastructure for quality improvement.
Theory for improvement
We theorised that interventions designed to optimise patient preparation, minimise the duration of ineffective ventilation and facilitate early recognition of failing intubation attempts would markedly reduce the frequency of desaturation during RSI. We developed a key driver diagram to make our theory explicit (see online supplementary appendix 1). Key drivers were based on our initial study, the relevant literature and a standard description of RSI.14
Patients and interventions
The disposition for all patients undergoing RSI in our ED is admission to a critical care unit, the OR or death. To identify patients for the current project, we used our institution's electronic health record (EHR) to generate a weekly list of all ED patients who were both evaluated in the resuscitation area and had one of these dispositions. A study investigator then manually reviewed the EHR to determine if RSI was performed in the ED for these patients. Using similar methods in a previous study, we captured 99% of patients undergoing RSI.13
The interventions were intended for all patients undergoing RSI during the testing period. The first intervention was an RSI checklist (see online supplementary appendix 2), modelled after the WHO's surgical safety checklist.15 The checklist's purpose was to promote recall of key aspects of the RSI process and to decrease cognitive load on team leaders. Checklist elements were designed to target key drivers and to address other aspects of RSI performed suboptimally in our initial study. The checklist included explicit time limits on several procedural steps: a 45 s pause between administration of the neuromuscular blocking medication and initiation of laryngoscopy, a 45 s limit on the duration of individual laryngoscopy attempts and a minimum of 1 min of reoxygenation following any unsuccessful attempt.
The second intervention was a pilot–copilot model for checklist execution. The ‘pilot’ was the physician team leader responsible for supervising the resuscitation and performing RSI. The ‘copilot’ was an additional ED provider charged with executing the checklist. The purposes of this intervention were to provide additional airway management expertise and to increase the likelihood that key processes were completed.
The third intervention was the restriction of laryngoscopy attempts to the following physician types: PEM faculty and fellows, anaesthesiologists and senior-level emergency medicine residents. In addition to removing the less formally trained providers (∼170 residents), the purpose of these restrictions was to maximise adoption of the interventions by providing a finite pool of providers for educational and reinforcement efforts.
The fourth intervention was the use of a video laryngoscope (Storz C-MAC, monitor 8401 ZX, module 8401 X, Karl Storz, Tuttlingen, Germany). The C-MAC may be used for either direct or video laryngoscopy, based on a blade design that mimics traditional Miller and Macintosh blades. We did not intend to use this device for video laryngoscopy; thus, we neither provided formal education on the performance of video laryngoscopy nor encouraged its use. Rather, providers performing the intubation were asked to use the video laryngoscope for direct laryngoscopy only. The video portion of the device was used by the copilot to see the intraoral aspects of the procedure, typically only visible to the provider performing direct laryngoscopy. The copilot's responsibility was to watch the video screen and verbalise tracheal or non-tracheal placement of the tube. The purposes of this intervention were to enhance crosschecking during laryngoscopy, to raise team-level situation awareness, to improve recognition of a failing attempt and to decrease the likelihood that a misplaced tube would go unrecognised.
Education of staff
Prior to testing of the interventions, all ED providers who might participate in RSI were educated on the project's objectives and the four interventions. The modes of education were formal presentations, email updates and informal conversations. One of the improvement team leaders (BTK) specifically trained all PEM faculty and fellows on the use of the checklist and the pilot/copilot roles.
Testing and refining the interventions
After drafting the initial interventions, we conducted multiple plan-do-study-act (PDSA) cycles to test and revise them, beginning with simulations on a high-fidelity human patient simulator (May 2012). Following the simulations, revisions were made to the checklist, the system to activate the copilot and the recommended positioning of the care providers and the video laryngoscope screen.
Testing of the interventions for actual ED patients began in July 2012. To understand how the interventions were being used and to inform further revisions, the improvement team met weekly to review each case. Early in the testing period, care providers were having difficulty completing time-based checklist elements. In response, digital timers were attached to the top of the video laryngoscope screen, one each for preoxygenation, the pause after neuromuscular blocker administration and the limit on the duration of each laryngoscopy attempt. Timer-specific language was added to the checklist, and the responsibility for timer activation was assigned to the ED respiratory therapist, a PEM fellow or the copilot.
Several PDSA cycles were conducted to determine the ideal type of provider for the copilot role. Ultimately, we decided a second PEM faculty physician should be the copilot in our ED. If a second PEM physician was unavailable, the care team was given autonomy to reassign the copilot role. Ultimately, a PEM faculty physician performed the copilot role almost exclusively.
During the first month of testing, we observed that traditional methods of communication and education seemed impersonal, being directed to all providers and not those for a specific case. To address this deficiency, we developed a standard provider feedback form (see online supplementary appendix 3). For each case, the form included the key process and outcome measures and a brief narrative summary. One to three weeks following the improvement team's review, the lead investigator emailed the feedback form to the physician team leader, the copilot, the lead and bedside nurses and the respiratory therapist.
Planning the study of the interventions
Data collection
Each ‘bay’ in our resuscitation area is equipped with a ceiling-mounted digital camera and microphone, both of which record continuously. With the exception of demographics, we collected data for this project primarily through review of video recordings. Videos were reviewed using a proprietary software program (VideoSphere, March Networks, Ontario, Canada). Prior to the testing period, the improvement team leader trained a research coordinator to collect data from these recordings. We employed the same approach used in our original study, where measures of interobserver agreement were high for time-based variables.13 All data were collected on a standard form and then entered into a Microsoft Access database (Microsoft, Redmond, Washington, USA). Following the end of data collection, two team members compared all completed data collection forms with the database to identify and correct discrepancies.
Methods of evaluation
To assess adherence to and the impact of the interventions, we measured the performance of six key processes, each corresponding to one or more key drivers: (1) use of the checklist, (2) appropriate preoxygenation, (3) use of the video laryngoscope on the first attempt, (4) appropriate laryngoscopist on the first attempt, (5) first laryngoscopy attempt duration ≤45 s and (6) confirmation of endotracheal tube (ETT) placement within 20 s using end-tidal carbon dioxide monitoring. We used the same definitions as in our original study.13 We defined checklist use as the copilot being present at the bedside with the checklist in hand and verbalising checklist items to confirm/ensure performance. We defined adequate preoxygenation as at least 3 min of uninterrupted administration of 100% oxygen immediately before administration of the RSI sedative medication.
Our main outcome was oxyhaemoglobin desaturation during RSI, defined as verbalisation of the pulse oximetry reading dropping to <90% during RSI. We defined the RSI interval as starting with the administration of the sedative and ending with securement of the ETT.
We collected data for numerous other aspects of the RSI process, including the completion of specific checklist elements, the number of laryngoscopy attempts and the occurrence of oesophageal intubation. We defined oesophageal intubation as verbalisation on the video recording that the ETT was inserted anywhere, but the trachea, including through visualisation of the video laryngoscope screen or by standard methods of confirmation, primarily end-tidal carbon dioxide monitoring and auscultation.
Analysis
To measure change in key processes and outcomes, we first considered p-charts. Our historical data indicated that 33% of patients undergoing RSI experienced at least one episode of desaturation. Based on this incidence, a minimum subgroup size of 22 patients would have been required to yield meaningful control limits.16 As there were 123 occurrences of RSI during the 12-month historical period, a subgroup size of 22 would have required >2 months to accrue, making the p-chart less useful for rapidly detecting change. Therefore, we constructed G-charts, a statistical process control chart that measures the number of patients between patients with the outcome of interest, for example, desaturation. We selected this method because of the relatively low incidence of RSI in our ED. We believed that G-charts would allow each occurrence to be immediately evaluated, fostering near real-time learning for an uncommon event.16 In addition to the key processes and desaturation, we theorised that attempt success might also change, with the potential for improvement. Thus, we constructed G-charts for the six key processes, attempt success and desaturation.
To calculate a baseline for the G-charts, we used data from the historical period (March 2009–April 2010); a baseline was not calculated for the checklist and video laryngoscope, as these were not in use during the historical period. To determine whether variation on the G-chart was statistically significant, we used accepted rules for the determination of common and special cause variations.16
Adjunctive to the G-charts, between the historical and testing periods, we directly compared the key process performance, attempt success and desaturation. As an additional measure of statistical significance, we calculated 95% CIs for the absolute percentage differences between periods. We compared the percentage of patients with desaturation between those older and younger than 24 months, as patients in the younger age group were at the highest risk for desaturation during the historical period. Finally, to determine whether completion of the interventions themselves was associated with improvement in the primary outcome, we stratified patients with desaturation by the number of key processes performed (all performed vs one or more not performed). We performed all data tabulations and calculations with Microsoft Excel 2010 (Microsoft), except for CI estimates, which we generated with an online calculator (http://vassarstats.net/prop1.html; http://vassarstats.net/prop2_ind.html).
Results
Patients
During the testing period (July 2012–September 2013), there were 75 cases of RSI. For two cases, oxygen saturation data were unavailable. During the historical period, data were collected for 114 (92%) of the patients who underwent RSI. Table 1 displays the patient characteristics for the historical and the testing periods. The two groups were nearly identical for all characteristics, except gender.
Characteristics of patients undergoing rapid sequence intubation in a single paediatric emergency department during two study periods
Performance of key processes
Special cause variation, evidenced by a data point outside the upper control limit, was noted for the following three key processes during the testing period: appropriate laryngoscopist on the first laryngoscopy attempt, first laryngoscopy attempt ≤45 s and end-tidal carbon dioxide confirmation within 20 s of insertion of the first ETT (figure 1A–C). Based on the occurrences of special cause variation and our team's high degree of belief that these occurrences were associated with the interventions, we adjusted the upper control limits and centre lines for these three process measures. Special cause variation was not detected for preoxygenation (figure 1D); the determination of special cause was not applicable for the two key processes for which baseline data were unavailable (see online supplementary checklist and video laryngoscope, appendix). By direct comparison (table 2), there was significantly better performance of the same three processes for which special cause variation was noted.
Performance of six key processes for patients undergoing rapid sequence intubation in a single paediatric emergency department during two periods
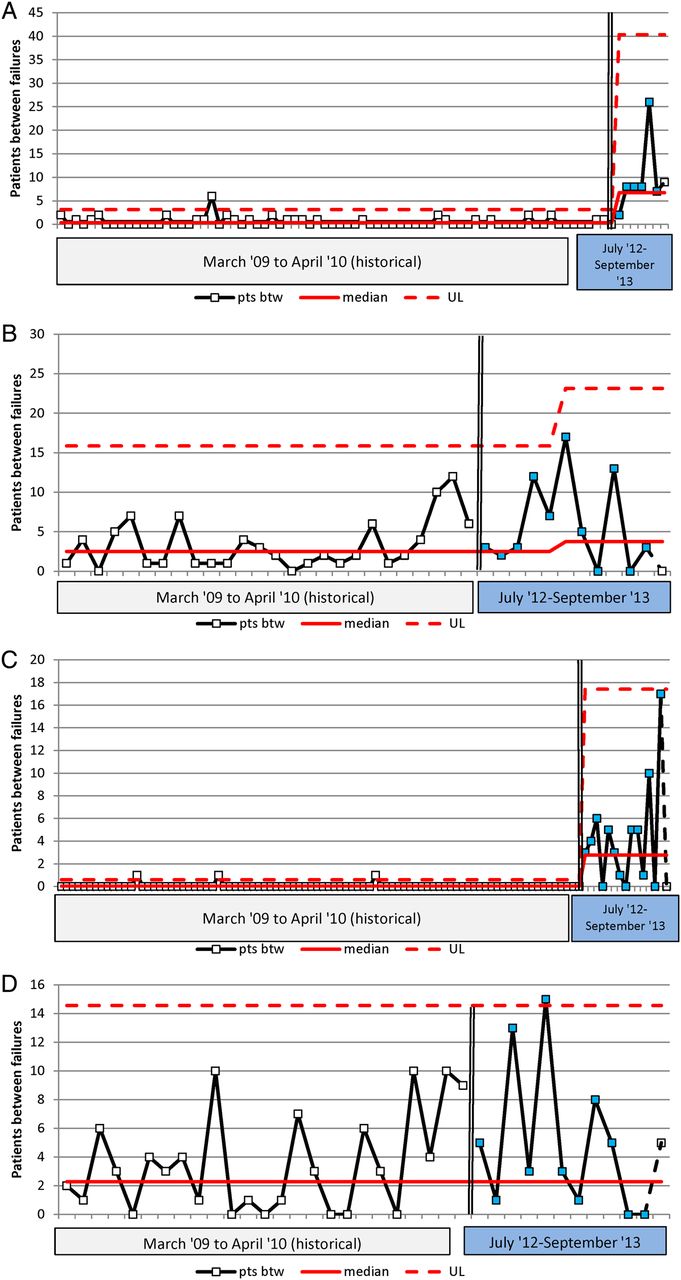
Statistical process control charts (G-charts) for six key processes of the rapid sequence intubation procedure. Y axis=number of patients between those with the outcome of interest, for example, preoxygenation failure. There were no data available to estimate a baseline for the use of the checklist and the video laryngoscope, as these were not in use prior to the improvement project. Squares indicate patients with process failures (pts btw); open squares are used for the historical period and closed squares for the testing period, except for the final square, which is open to indicate a lack of failure in the final run of patients. The 2-year gap between periods, for those processes with baseline data, is indicated by a vertical bar. The median is indicated by a solid line and the upper control limit (UL) by a dashed line; these lines were adjusted primarily after the occurrence of a single point above the UL. Preoxygenation failure was defined as an inappropriate method of administration or longest continuous duration <3 min. End-tidal carbon dioxide monitoring failure was defined as not having been used at all to confirm placement of the first insertion of an endotracheal tube.
The checklist was used for 69 of 75 cases (92%) during the testing period. Fourteen checklist items were applicable to all patients. When the checklist was used, the processes corresponding to these 14 items were performed an average 88% of the time (range 75%–90%). RSI steps completed more frequently when the checklist was used included: discussion of the potential for a difficult airway (75% with checklist vs 33% without), 45 s pause after administration of the neuromuscular blocker (97% vs 33%) and visualisation of the ETT passing the vocal cords on the video screen (90% vs 0%). The high percentage of checklist usage precluded an assessment of the statistical significance of these differences. The checklist was used for all 27 cases with at least one failed attempt; correct reoxygenation after first attempt failure was performed for 67% of these cases, and there was a change in the approach to laryngoscopy/intubation on the subsequent attempt for 78%.
Attempt failure
Special cause variation occurred for first or second attempt failure (see online supplementary appendix 4), indicating improved success of laryngoscopy attempts over time. Both the first and second attempts failed for 9% (7/75) of patients in the testing period versus 26% (30/114) historically (absolute difference 17%, 95% CI 6% to 27%).
Oxyhaemoglobin desaturation
Special cause variation was first detected in the occurrence of desaturation in November 2012, followed by another point above the upper control limit in May 2013 (figure 2). Based on these special causes and our team's degree of belief that they were related to improvements in key process measures, we recalculated the centreline and upper control limit; the median number of patients between episodes of desaturation increased from one to four.

Statistical process control chart (G-chart) for the main outcome: oxyhaemoglobin desaturation during rapid sequence intubation. Y axis=the number of patients between those with desaturation. Circles indicate a patient with desaturation, open circles for the historical period and closed circles for the testing period (pts btw). For the final patient in the testing period, an open circle indicates that there were no patients with desaturation in the final series. The 2-year gap between periods is indicated by a vertical bar. The median is indicated by a solid line and the upper control (UL) limit by a dashed line; these lines were adjusted after the occurrence of a single point above the UL. The two patients for which desaturation could not be determined are not included in this chart.
During the testing period, desaturation occurred for 16% (12/73) of patients, compared with 33% (38/114) during the historical period (absolute difference 17%, 95% CI 4% to 28%). For two cases during the testing period, the occurrence of desaturation could not be determined (pulse oximeter malfunction during RSI). Multiple episodes of desaturation occurred for 3% (2/73) in the testing period, compared with 16% (18/114) in the historical period (absolute difference 13%, 95% CI 4% to 21%). For patients aged 24 months or younger, desaturation occurred for 27% (9/33) during the testing period, compared with 60% (32/53) during the historical period (absolute difference 33%, 95% CI 11% to 50%). All six key processes were performed for 34 cases (45%) during the testing period. Desaturation occurred for 6% (2/34) of these patients, compared with 24% (10/39) if one or more key processes were not performed (absolute difference 18%, 95% CI 2% to 34%).
Discussion
The aim of this improvement project was to reduce the incidence of oxyhaemoglobin desaturation during RSI in our paediatric ED. We accomplished this aim, and we believe the decreased incidence of desaturation was linked both to improved performance of three key processes (appropriate laryngoscopist, first attempt ≤45 s and end-tidal carbon dioxide within 20 s) and greater success on the first two attempts. We acknowledge the delay between the improvement in the key processes and the outcome. We believe this delay is explained by the time required to refine the interventions through multiple PDSAs, including those related to the digital timers, pilot/copilot role and provider feedback.
For young, critically ill or injured children, the complexity of the RSI procedure cannot be overstated. The orchestration of numerous interdependent steps, while ensuring all non-procedural care is delivered, can challenge even the most seasoned team leaders. In one report describing a scoring tool for the performance of endotracheal intubation, the performing provider was responsible for 34 separate steps.17 Compounding this complexity is the relative rarity of RSI at the provider level2 and the high degree of variation in the experience and make-up of ED care teams. We designed and implemented an RSI checklist, and a pilot/copilot model for checklist execution, to reduce the cognitive load on the team leader and increase the performance of key RSI processes.
Few published reports describe formal efforts to improve the process of emergency intubation.18–21 Jaber et al19 described the impact of a ‘bundle management protocol’ on the safety of emergent intubation in three intensive care units in France. Introduction of the protocol was associated with a reduction in life-threatening complications from 34% to 21%, a baseline and improvement similar to our findings. The protocol included 10 items, four of which overlap with aspects of our interventions.
Checklists have been advocated as an ideal tool to improve the performance and safety of complex procedures in healthcare,22 and checklist-based interventions have been associated with improvements in the safety of surgery and central line placement.15 ,23 As noted in recent editorials,24 ,25 simply asking providers to complete a checklist is likely insufficient to improve outcomes for any procedure. Checklists may be ideal instruments on which to focus broader and deeper education and reinforcement efforts.24 Checklists for emergency and elective intubation have been published.18 ,26–28 Although sharing common elements with our checklist, none of these were accompanied by controlled analyses, and none used direct observation/video review for data collection. This latter point is crucial to interpretation of our results, as we were able to confirm rather than assume that the checklist was used.
Removing a subset of trainees from the pool of providers performing laryngoscopy and intubation may have directly reduced failed and prolonged attempts and indirectly reduced the frequency of desaturation. We believe, however, that other aspects of the interventions contributed to improved attempt success. PEM fellows performed 60% of first attempts in the testing period, but were not significantly more successful than residents in the historical period (43% first attempt success, 47% overall vs 35% first attempt, 36% overall). Moreover, when all key processes were performed, the frequency of desaturation was especially low. All 12 patients with desaturation during RSI had the correct intubating provider on the initial attempt; desaturation did not occur for the five cases with an incorrect intubating provider on the initial attempt.
We believe that our project produced a culture of improvement around RSI. Several aspects of the project contributed to this, including transparent reporting of our less-than-ideal baseline performance of RSI, our leadership's consistent support, the willingness of our providers to experience the vulnerability of video review, the integration of peer review in the form of individual provider feedback forms and the continued integration of the RSI checklist in an organised simulation programme. However, despite the documented improvement in our primary outcome and our increasing confidence in a linkage between this improvement and key processes, the sustainability of improvement is not convincingly addressed by the data presented thus far. The complexity of our interventions and the resources required to employ them may limit sustained improvement.
We constructed a p-chart post hoc to better assess whether the special cause variation noted on the G-charts truly reflected sustained improvement (figure 3). To construct the p-chart, we used limited data we continued to collect following completion of the project. Our chosen subgroup size of 10 limited the utility of the lower control limit, but special cause variation evidenced by a run of eight points below the centreline was noted. We are cautiously optimistic that the reduced incidence of desaturation achieved during the improvement project has been sustained during the 2 years since the project ended.

P-chart for oxyhaemoglobin desaturation during rapid sequence intubation. Y axis=proportion of subset of patients with desaturation. Subset=10 for all points except last (n=7). The double vertical line indicates the 2-year gap in data collection (April 2010–July 2012). Patients for whom desaturation could not be determined are not included.
Limitations
The results of our project should be interpreted in light of several limitations. First, there was a 2-year gap between the historical and intervention periods, as we were not collecting video data during this period. The data from our original study was published during this 2-year period, but there were no specific interventions to improve RSI performance, and patient characteristics were generally similar between the two periods. Second, there was a notable reduction in the number of patients undergoing RSI in the intervention period (75 in 15 months vs 114 in 12 months). We are not certain whether this difference was due to secular trend, specific decisions not to perform RSI, random variation or a combination. There was a difference in gender between the historical and intervention periods, but gender is unlikely to impact the decision to perform RSI. As noted, patient characteristics were, otherwise, similar. Third, we did not have continuously measured pulse oximetry data to determine desaturation. It is possible that the care team failed to verbalise desaturation and that the frequency of verbalisation differed between the two study periods. We now include the patient monitor in our data collection, and have noted that the care team rarely fails to verbalise episodes of desaturation; failure to verbalise the depth and duration of desaturation are more common. Although we believe that the frequency of verbalisation was likely similar during study periods, this is a significant limitation that would only be resolved through the collection of continuously recorded, accurate vital sign data. Fourth, it is possible that ‘easier’ cases may have been associated with both checklist usage and item completion. The checklist was used, however, for >90% of patients during the testing period, making it unlikely that it was used only for less complicated cases. Finally, as we tested them simultaneously, we are unable to determine the contribution of individual interventions to improvement in the primary outcome.
Conclusion
The introduction of four interventions in an academic paediatric ED was associated with improved performance of several key RSI processes and attempt success. We believe these improvements directly improved attempt success and reduced the incidence of oxyhaemoglobin desaturation during RSI. Improved RSI performance, attempt success and safety were realised without extensive efforts to improve the airway skills of ED providers.
Acknowledgments
We gratefully acknowledge the support of the following individuals and groups, without whom our project would have been impossible to complete: Karen Ahaus and Tina Eubanks, Rachel Talley, Michelle Caruso, Richard Ruddy and the entire Division of Emergency Medicine and Emergency Services at Cincinnati Children's Hospital.
References
Supplementary materials
Supplementary Data
This web only file has been produced by the BMJ Publishing Group from an electronic file supplied by the author(s) and has not been edited for content.
- Data supplement 1 - Online supplement
- Data supplement 2 - Online supplement
- Data supplement 3 - Online supplement
- Data supplement 4 - Online supplement
- Data supplement 5 - Online supplement
Footnotes
Contributors All authors contributed to generation of the project idea, its overall design, testing and revision of the interventions and composition of the manuscript. BTK was the project leader, and was primarily responsible for all educational efforts and drafting of the manuscript. MRM, KRV, JWL and SBI provided expertise on quality improvement methodologies. JWL acted as project champion. MEF and TEJ were responsible for primary education of non-physician providers. JD collected all project data, maintained the project database and assisted with all educational efforts. BTK, SBI and MRM lead the revision process for the first and second resubmission.
Competing interests None declared.
Ethics approval Head of the Institutional Review Board.
Provenance and peer review Not commissioned; externally peer reviewed.
Data sharing statement All data collected for our project are available for internal use only.