Article Text

Abstract
Objectives Early detection is of crucial importance for prevention of type 2 diabetes and pre-diabetes. Diagnosis of these conditions relies on the oral glucose tolerance test and haemoglobin A1c estimation which are invasive and challenging for large-scale screening. We aimed to combine the non-invasive nature of ECG with the power of machine learning to detect diabetes and pre-diabetes.
Methods Data for this study come from Diabetes in Sindhi Families in Nagpur study of ethnically endogenous Sindhi population from central India. Final dataset included clinical data from 1262 individuals and 10 461 time-aligned heartbeats recorded digitally. The dataset was split into a training set, a validation set and independent test set (8892, 523 and 1046 beats, respectively). The ECG recordings were processed with median filtering, band-pass filtering and standard scaling. Minority oversampling was undertaken to balance the training dataset before initiation of training. Extreme gradient boosting (XGBoost) was used to train the classifier that used the signal-processed ECG as input and predicted the membership to ‘no diabetes’, pre-diabetes or type 2 diabetes classes (defined according to American Diabetes Association criteria).
Results Prevalence of type 2 diabetes and pre-diabetes was ~30% and ~14%, respectively. Training was smooth and quick (convergence achieved within 40 epochs). In the independent test set, the DiaBeats algorithm predicted the classes with 97.1% precision, 96.2% recall, 96.8% accuracy and 96.6% F1 score. The calibrated model had a low calibration error (0.06). The feature importance maps indicated that leads III, augmented Vector Left (aVL), V4, V5 and V6 were most contributory to the classification performance. The predictions matched the clinical expectations based on the biological mechanisms of cardiac involvement in diabetes.
Conclusions Machine-learning-based DiaBeats algorithm using ECG signal data accurately predicted diabetes-related classes. This algorithm can help in early detection of diabetes and pre-diabetes after robust validation in external datasets.
- diabetes mellitus
- early diagnosis
- primary healthcare
Data availability statement
Data are available on reasonable request. The data are confidential and not publicly available. The codes and notebooks are available on reasonable request to the authors.
This is an open access article distributed in accordance with the Creative Commons Attribution Non Commercial (CC BY-NC 4.0) license, which permits others to distribute, remix, adapt, build upon this work non-commercially, and license their derivative works on different terms, provided the original work is properly cited, appropriate credit is given, any changes made indicated, and the use is non-commercial. See: http://creativecommons.org/licenses/by-nc/4.0/.
Statistics from Altmetric.com
WHAT IS ALREADY KNOWN ON THIS TOPIC
Electrocardiography (ECG) can provide early clues in diabetes and pre-diabetes.
WHAT THIS STUDY ADDS
Based on beat morphology, machine learning detected diabetes and pre-diabetes with an accuracy of 97%, precision of 97%, recall of 96% and F1 score of 96% in an independent test set with low calibration error (0.06).
Localisation of important ECG features was consistent with the biological mechanisms underpinning cardiac involvement in diabetes and pre-diabetes.
HOW THIS STUDY MIGHT AFFECT RESEARCH, PRACTICE AND/OR POLICY
The non-invasive nature of ECG combined with the power of machine learning has potential for a screening method to detect type 2 diabetes and pre-diabetes.
If externally validated, DiaBeats can be used as a gatekeeper to stratify individuals based on risk of diabetes and pre-diabetes, especially in low-resource settings.
Introduction
The global epidemic of diabetes continues to burgeon.1 Estimates suggest that the world-wide prevalence of diabetes in adults (>18 years of age) was 9.3% (463 million people affected) in the year 2019.2 Two aspects related to these estimates are of critical importance. First, the current estimates of diabetes prevalence around the globe are likely to be an underestimate of the true diabetes burden.3 Second, diabetes is frequently preceded by pre-diabetes—a condition that is more tenable to preventive measures and effective in diabetes prevention.4 Thus, early detection of pre-diabetes and diabetes is of utmost importance in a concerted effort to reduce global diabetes burden.5 6 It is notable that the definitions for diabetes and pre-diabetes rely heavily on the measurement of blood glucose (ideally in the setting of an oral glucose tolerance test, OGTT) and haemoglobin A1c (HbA1c) concentrations which are both invasive and challenging to roll out as screening methods especially in low-resource settings.7–9
The cardiovascular system is an early target of the diabetic process. Even in the absence of a frank cardiac disease and appreciable dysglycaemia, there continue to be perturbation in the autonomic control of cardiac function in pre-diabetes and diabetes.10–12 Further, the diabetic process is marked with structural changes as seen in diabetic cardiomyopathy and cardiac fibrosis.13 For example, it has been posited14 that hyperglycaemia, reactive oxygen species, accumulation of advanced glycation end-products (AGE) and the abnormalities in neurohormonal regulation together contribute to a degenerative process characterised by cardiac fibrosis. These structural and functional changes in the cardiovascular system can be detected very early during pre-diabetes/diabetes progression even when dysglycaemic symptoms have not yet surfaced.15
Since cardiac autonomic neuropathy and cardiac fibrosis can both alter the electrical properties of heart and since electrocardiography (ECG) is non-invasive, we reasoned that ECG can be used for early detection of pre-diabetes and diabetes. Previous attempts in this direction include using electronic health records and natural language processing to predict diabetes,16 using deep learning (DL) techniques to investigate the predictive ability of heart rate signals in diabetes detection,17 ECG-based detection of impending hypoglycaemic events in critical care18 and using raw ECG to predict diabetes.19 More recently, the IRGNet architecture20 was developed to predict pre-diabetes (defined as presence of impaired fasting glucose or impaired glucose tolerance or both) which achieved an accuracy of 85% to predict pre-diabetes. However, a comprehensive effort to predict the spectrum of diabetic affliction (including latent diabetes defined on the basis of HbA1c concentrations) is currently lacking.
The aim of this paper is to demonstrate how machine learning (ML) techniques can be used to harness the screening potential of ECG to predict pre-diabetes and type 2 diabetes. Here, we present our results that demonstrate the screening potential of ECG when combined with ML to predict pre-diabetes and diabetes in a field study of ethnically endogenous, high diabetes risk population in India. Using data from this field study, we compared the classification performance of several ML and DL architectures with a goal to predict the diabetes status. We also added interpretive value to the classification to gain insights into the potential ECG features that can differentiate individuals based on diabetes status. Finally, we also investigated whether concomitant comorbidities and demographic conditions can influence the classification performance of our ML model.
Methods
Study participants
Data for this study come from the Diabetes in Sindhi Families in Nagpur (DISFIN) study. The DISFIN study focused on the determination of the genetic basis of type 2 diabetes and other metabolic traits within the families of an ethnically endogenous population (Sindhis) with high risk of type 2 diabetes. Detailed inclusion and exclusion criteria for this observational study are described in its registration page on ClinicalTrails.gov (study id NCT03918525). Briefly, families with at least one known case of type 2 diabetes and living in the Jaripatka, Mecosabagh or Khamla areas of Nagpur (where there is maximum density of Sindhi population) were enrolled in the study. Detailed personal and family history, clinical assessment, diet history, anthropometry and laboratory investigations were carried out on all consenting participants.
Definition of type 2 diabetes and pre-diabetes
As a part of the full protocol DISFIN participants underwent ECG, fasting plasma glucose (FPG), fasting plasma insulin, HbA1c and random blood glucose (RBG) and fasting serum C-peptide measurements. Type 2 diabetes was defined in accordance with the definition of the American Diabetes Association criteria.21 Specifically, type 2 diabetes was considered present when one or more of the following criteria were met: self-reported diabetes on anti-diabetic medication, FPG≥7.0 mmol/L, HbA1c ≥6.5% or RBG ≥11.1 mmol/L. Pre-diabetes was defined as presence of one or more of the following criteria in the absence of type 2 diabetes: FPG 5.56–6.99 mmol/L or HbA1c 5.7%–6.49%.
Electrocardiography
All the study participants were offered the standard, 12-lead ECG. All ECGs were recorded using the BPL Medical Technologies’ digital ECG device (Cardiart 6208) with following specifications: recording duration – 10 s, ≥12 bit analogue to digital converters, 0.05–150 Hz bandwidth and a sampling frequency of 1000 Hz. All recordings were saved as dicom files and used for analyses in a deidentified fashion.
Data preprocessing
Figure 1 shows the overall analytical pipeline and the preprocessing steps (orange bordered box in figure 1) used in this study. The unit of analyses for this study was a heartbeat. Raw ECG signals extracted from the dicom files were first subjected to median filtering (kernel size 11), then bandpass filtering (within the range of 5–40 Hz) and then standard scaled. These preprocessed signals were then passed through a QRS-detector algorithm that identified all the R peaks. To ensure that all beats extracted with have full set of available features, we trimmed the detected R peaks list to exclude the first and last (potentially incomplete) beats. These beats were then aligned such that the R peak always represented the centre of a 0.8 s wide window. These extracted beats were used for training and validation.

Data preparation. This study used 10 s recordings of 12-lead ECGs sampled at 1000 Hz. A total of 1262 ECGS fulfilled the inclusion criteria and were subjected to preprocessing (orange bordered box labelled as P). Total 10 461 beats were extracted which were split into three parts—a training set (85%), validation set (5%) and independent test set (10%). The training set was then subjected to SMOTE algorithm to achieve comparable prevalence of no-diabetes, pre-diabetes and diabetes classes. The preprocessing steps (shown in the blown-up orange box on the right) included median filtering with a kernel size of 11, followed by bandpass filtering within the range of 5–40 Hz and standard scaling (difference from mean over SD). This preprocessed signal was used to extract R peaks and was fragmented with a width of 0.4 s on either side of the R peak. To reduce the potential distortion at the ends of the ECG recording we trimmed the sequence by removing the first and the last beats. All extracted beats were aligned to represent the R peak at the centre of the beat sequence. Shown in the orange bordered box is an example of a raw signal (red coloured tracing), the result of preprocessing (blue tracing) and the extracted beat sequence. For ease of presentation this example uses ECG recording from lead II only. DISFIN, Diabetes in Sindhi Families in Nagpur; SMOTE, Synthetic Minority Oversampling Technique; T2D, type 2 diabetes.
Training the ML algorithm
The aligned beats were then down sampled to a frequency of 125 Hz. Thus, the resulting beat-level waveforms had a total of 100 unique features per lead. These features were horizontally concatenated to generate a set of 1200 features (12 leads × 100 features) per heartbeat. This feature set was used for training and validation of the ML algorithm. As shown in figure 1, the full feature set of extracted beats was split into a training set (85%), a validation set (5%) and an independent test set (10%).
As a first step, we examined the comparative predictive performance of five ML techniques—component-wise boosting, multilayer perceptron, probabilistic neural network, random forest and extreme gradient boosting (XGBoost) algorithm. These ML algorithms have been commonly used in clinical classification tasks. This comparison was done in a 10-fold cross-validation scenario restricted to the training set only for a prefixed number of 10 iterations. From these techniques, the best performing techniques (based on minimum misclassification error, low Brier score and high classification confidence) was chosen for further training. For comparison, we used three metrics (misclassification error, Brier score and predictive confidence). Based on these analyses, we chose a technique that provided least misclassification error, lowest Brier score and highest confidence.
Training was then undertaken by extensive hyperparameter tuning (using grid search) with a goal to minimise the multiclass log loss and maximise the multiclass classification accuracy. Training was continued till the loss and accuracy metrics plateaued (with patience level of 5). Best model with the least loss and maximum accuracy was chosen as the final model.
Validation of the best model
The best ML model was evaluated during training against the validation set. The validation performance of the model was evaluated using four metrics: precision (comparable to positive predictive value in epidemiology), recall (comparable to sensitivity in epidemiology), accuracy and F1 score (summarised using the macro method). These analyses were based off a confusion matrix that cross-tabulated the actual and predicted classes. The predictive performance of the best ML model was then evaluated in a similar fashion in the independent test set that was not used for any analyses prior to this step. To determine the generalisability of the best ML model, we generated a calibration curve and estimated the expected calibration error (ECE) using established methods.22 23 Finally, the results were interpreted in the light of the gain-derived feature importance (expressed as F score)24 to mark specific locations within a beat that provided maximum discriminatory information.
Comparison with DL models
We also compared the classification performance of the XGBoost model with that of other DL architectures based on long short-term memory (LSTM), 1-dimensional convolution neural networks (1D-CNN), the deepECG model and a time-series transformer-based classifier. The details of the rational and architecture of these models are provided in online supplemental note 1. Briefly, the DL models used for comparison were based on combinations of LSTM, 1D-CNN and transformer blocks and reflected a wide spectrum of parameter space (ranging from a minimum of 24 579 to a maximum of 433 523 parameters. All the DL models used the same dataset as that used by the DiaBeats algorithm and used the same optimiser (Adam), learning rate (0.0001), stopping criteria (loss patience of 5) and input and output layers (online supplemental note 1).
Supplemental material
Analytical platform
All ML-related analyses were conducted using Python V.3.7 within an Anaconda environment.25 Following python libraries were used for specific analytical tasks: Scipy (for signal preprocessing),26 Numpy (for beat representation and vectorised analyses),27 WFDB (for R peak detection and beat alignment, https://pypi.org/project/pywfdb/), xgboost (for XGBoost training, https://pypi.org/project/xgboost/), Scikit learn (for creating confusion matrices, performance metrics and feature importance metrics)28 and, netcal (for calibration curves).29 All python codes are available from the authors on reasonable request. Head-to-head predictive comparison of different ML techniques was conducted in R using the CMA30 and xgboost31 libraries. Balancing of the dataset was done using the smotefamily library in R.32 Experiments related to comparison with DL models were conducted using the Tensorflow (www.tensorflow.org) and Keras (https://github.com/keras-team/keras) platforms. All statistical analyses were conducted using Stata V.12.0 (StataCorp) software package.
Patient and public involvement
Study participants were only involved during the phase of data collection but were not involved in the study design, analyses, reporting or dissemination of the study results.
Results
Study participants
As shown in figure 1, the study data came from a total of 1262 individuals out of the 1462 participants enrolled. Ground truth (reference standard) status about type 2 diabetes was not available for 52 participants while ECG recordings were not available for an additional 36 participants. Hence, 1374 participants were eligible for inclusion in this study. We aimed to include ECG recordings that were minimally influenced by artefacts like person movement, electrical interference and poor recording in one or more leads. We, thus, restricted this dataset using a global criterion of the total voltage range (all leads, all times) between −2 and+2 mV. Using this criterion, we finally included clinical data and ECGs for 1262 individuals. A comparison of the included and excluded individuals based on study characteristics is shown in table 1). Overall, the excluded participates had a higher proportion of males, were leaner, more hypertensive and had a higher prevalence of known cardiac conditions as compared with the included participants.
Characteristics of the study participants
The included participants were on an average ~48 years of age and were predominantly (61%) females (table 1). Since the primary DISFIN study was designed to enrol families with at least one known case of type 2 diabetes and since the study focused on endogenously related families, the prevalence of both type 2 diabetes and pre-diabetes was high in this study (~30% and 14%, respectively). Also, the prevalence of insulin resistance was 35%. Similarly, the coexistence of other metabolic conditions like hypertension (51%), obesity (~40% based on BMI≥30 Kg/m2) and dyslipidaemia (36%) was also high. From 10 s ECG recordings of these participants, we extracted a total of 10 461 heart beats as shown in figure 1. The distribution of target classes in these 10 461 beats was as follows: no diabetes 5744 (54.91%); pre-diabetes 1398 (13.36%) and type 2 diabetes 3319 (31.73%) which was very similar to the distribution of the number of participants in these classes.
Choice of best performing ML technique
Using the training set only and training under a 10-fold cross-validation scenario, we compared the predictive performance of six candidate ML methods mentioned earlier. The results of these analyses are shown in online supplemental figure 1 and indicated that XGBoost was associated with least misclassification error (0.07), lowest Brier score (0.07) and highest confidence (0.82). We, therefore, used XGBoost as the ML classifier in all the following analyses.
Training and predictive performance of DiaBeats
Within the randomised training set of 8892 beats (85% of all beats, figure 1) the prevalence of no diabetes, pre-diabetes and type 2 diabetes classes was 54.87%, 13.56% and 31.57%, respectively. Thus, there existed a class imbalance with pre-diabetes as the least represented class. Therefore, we first used the SMOTE algorithm to generate a balanced dataset that yielded approximately equal instances of each class. The resulting balanced training dataset contained a total of 14 637 beats equally distributed with respect to the target classes. This balanced dataset retained all the instances from the original training set and added the oversampled nearest neighbours for the two minority classes to make up equal number of instances per target class. Hyperparameter grid search provided the following estimates which were used for further training: learning rate (eta) 0.1, maximum tree depth 16, subsample fraction 0.8, L2 regularisation (lambda) 2 and booster type gbtree.
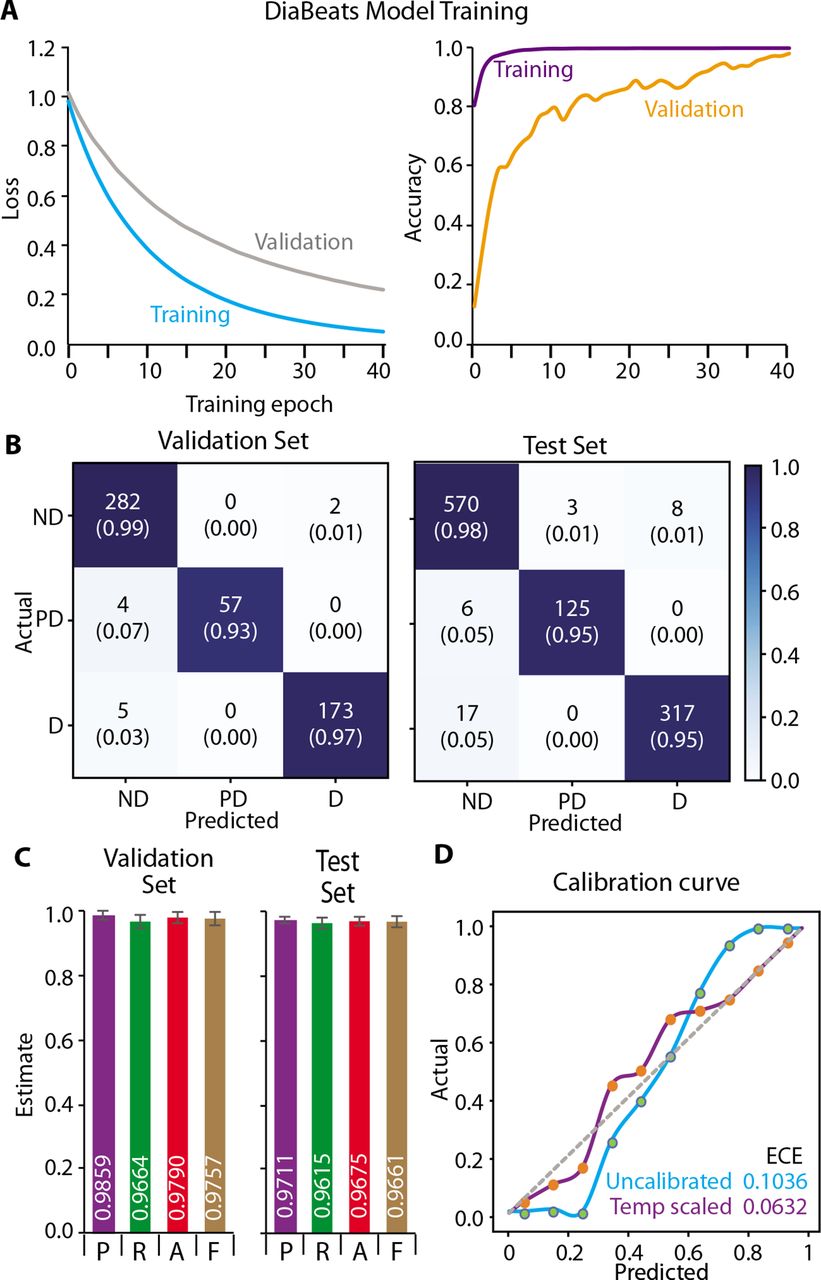
Training of the XGBoost-based DiaBeats model was smooth and rapid (as indicated by the loss curves shown in figure 2A). There was a monotonic decrease in the multiclass log loss for both the training and the validation sets with the loss for the latter set staying consistently higher throughout the training process. Convergence was achieved within 40 epochs. Conversely, the predictive accuracy of the training set reached near perfection during the first 16 epochs but that for the validation set stabilised after 34 epochs at ~98%. The predictive performance of the DiaBeats model is shown in figure 2B,C in the validation as well as the independent test set. The confusion matrices (figure 2B) showed that both in the validation and the test sets the DiaBeats algorithm discriminated among the target classes effectively as indicated by aggregation of the numbers along the diagonal of the confusion matrix and very few beats incorrectly classified off-diagonally. Also, the proportion of correctly classified beats within each target class was consistently high (>93% in the validation set and >95% in the independent test set. These confusion matrices distilled into impressive performance metrics for the DiaBeats model as shown in figure 2C. The precision, recall, accuracy and F1 scores were very high for both the validation and the independent test sets. Indeed, when we dichotomised the dataset as diabetes or pre-diabetes versus ‘no diabetes’, the predictive accuracy of the DiaBeats algorithm in the independent test set was 99.58% (95% CI 99.36% to 99.81% (online supplemental figure 2).

Training and predictive performance of the machine learning model. (A) The plot shows multiclass log loss (left axis) and the prediction accuracy (right axis) for the training and the validation sets. The model achieved convergence after 44 training epochs. (B) Confusion matrices for the predictive performance of the model in the validation set (left) and the independent test set (right). Cells of the confusion matrices show the number of classified beats and the proportion out of the ground truth class labels. The cells are colour coded according to the colour index shown on the right side. (C) Performance metrics for the DiaBeats model in the validation set (left) and the independent test set (right). The bars represent precision (P), recall (R), accuracy (A) and F1 scores (F) along with the confidence intervals. The mean predicted metrics are shown as white coloured numbers at the bottom of the bars. (D) Calibration curve. Diagonal line shows perfect calibration while the cyan and purple curves shows the calibration of the original and temperature scaled model. The expected calibration error (ECE) for these two models is shown in a color-coded fashion at the lower-right corner of the plot. D, type 2 diabetes; ND, no diabetes; PD, pre-diabetes.
Lastly, when we examined the classification confidence using calibration curve, we observed that the ECE of the original, uncalibrated prediction was 10.36% (figure 2D, cyan curve). After temperature scaling, the revised estimates of the classification confidence provided an ECE estimate of 6.32% (>4% improvement). Hence, we used these revised and scaled probability estimates as the basis of predictions from the DiaBeats model.
Feature importance
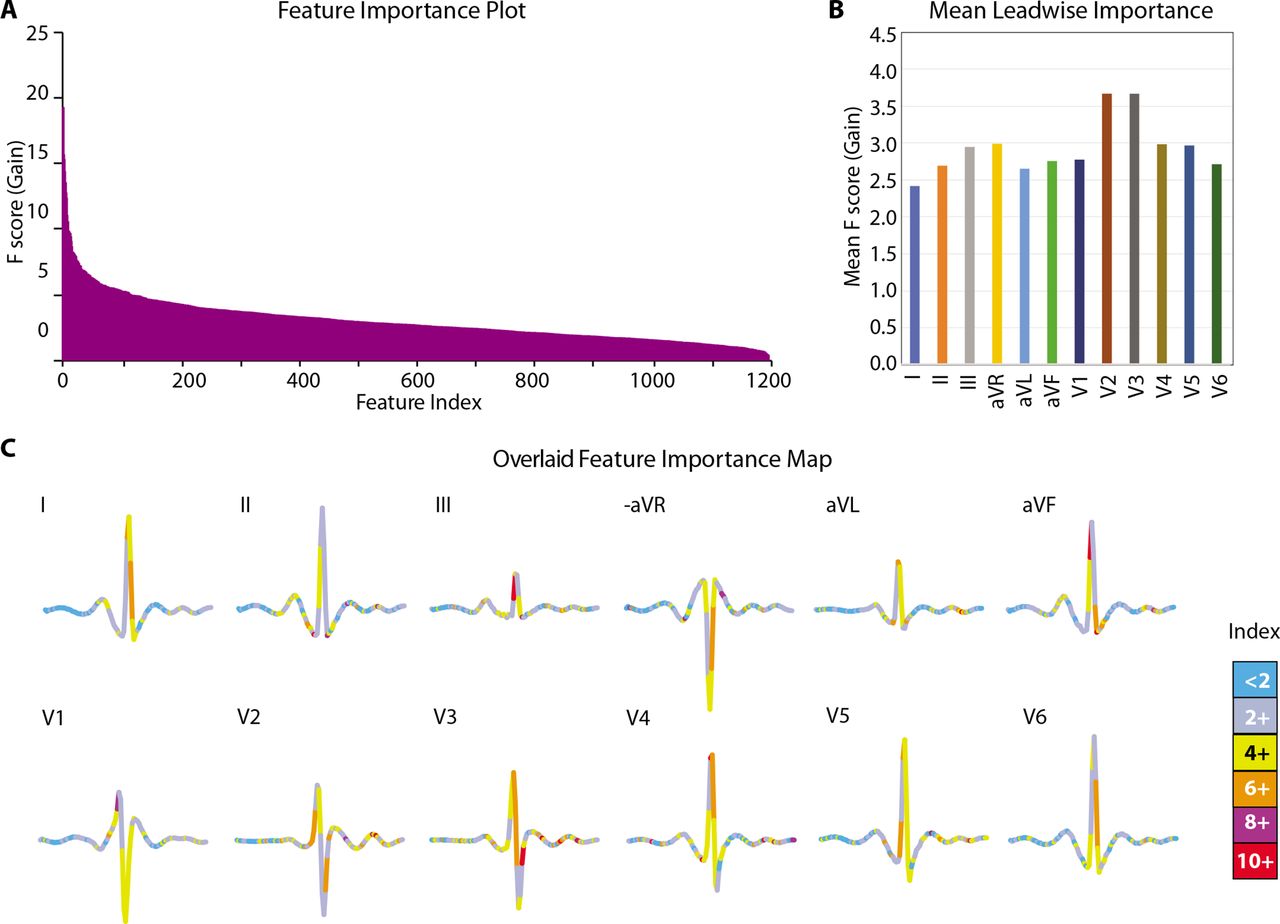
As a final interpretive step, we investigated the contribution of the specific ECG features to the overall model prediction. For this, we used the F-score for the gain metric and compared the feature importance across all the 1200 features used in the DiaBeats model. We found (figure 3A) that the highest importance of 21.72 was for feature #550 (located in lead augmented Vector Foot (aVF)) which rapidly decreased to <10 after the top 14th feature (feature ID #633 located in lead V2). After that there was a more gradual decrease in the feature importance estimates. Of the top 25 most important features, there were five each located in leads V3 and V4, followed by three each in leads V2 and aVF; two each in leads II, III, augmented Vector Right (aVR) and V5; and one in lead augmented Vector Left (aVL). These results indicated that major discriminatory information for the DiaBeats model came from the chest leads (especially V2 and V3), augmented limb leads and lead III. Indeed, the mean F score for all features located in each lead (figure 3B) was highest for lead V2 (3.69), followed by lead V3 (3.68) but least for leads I, aVL and II (2.42, 2.66 and 2.70, respectively). To further visually inspect the location of feature importance, we created an average heartbeat for all study beats belonging to the ‘no diabetes’ class. We plotted this average beat lead-wise and color-coded the plots based on the estimated feature importance. We found (figure 3C) that the region of QRS complex in all chest leads and in lead III and the T waves in leads V2, V3 and V5 were especially important for the classification problem studied here.

Variable importance for the DiaBeats model. (A) Feature importance (F score) for all 1200 features as well as average importance of features for each ECG lead (B). Features are sorted in descending order in A. Importance shows the average gain across all splits when a feature was used. Variable importance is measured as F score for gain. (C) Map of feature importance on the backdrop of an average ECG of participants with ‘no diabetes’. All 12 leads of an average ‘no diabetes’ ECG are shown with colour codes reflective of the feature importance as depicted in the colour index. avF, augmented Vector Foot; aVL, augmented Vector Left; aVR, augmented Vector Right.
Comparison of DiaBeats algorithm with DL frameworks
Lastly, we compared the classification performance of our algorithm with that of five DL models that have been previously used for time series classification. Details of these five models are provided in online supplemental note 1 and online supplemental figures 5–9. We found (online supplemental table 1) that the accuracy of the XGBoost-based DiaBeats algorithm was higher than that of each of the five DL models in all three datasets (training, validation and test). The computationally complex algorithm based on transformers achieved the lowest classification accuracy (~75% in the test set) but took a long time to converge (~7 hours on a GPU-enriched hardware). The results shown in online supplemental table 1 demonstrated that depth and model complexity did not improve the classification accuracy and that the XGBoost classifier outperformed all the candidate ML (online supplemental figure 1) and DL (online supplemental table 1) models studied.
Discussion
In this study, we have demonstrated the potential use of an ML-driven approach using ECG to detect diabetes and pre-diabetes at the level of a single heartbeat. Our algorithm (DiaBeats) was highly accurate in both the validation set as well as the independent test set. The limitations of OGTT and HbA1c in population screening for diabetes are well known.6 33–36 In comparison, there are clear benefits in using ECG as a gatekeeper for diabetes/pre-diabetes. First, ECG is non-invasive. Second, ECG is relatively inexpensive. For example, based on a survey of laboratory practices in India (www.medifee.com) the average end-user price of OGTT and HbA1c estimation is currently ₹760 (₹321 and ₹439, respectively) while that of a standard ECG measurement is ₹214. Third, while the DiaBeats algorithm is specifically trained to detect diabetes/pre-diabetes; an ECG can yield a far richer information spectrum about coexisting cardiovascular conditions, and therefore, simultaneously act as a first-level screen for the overall cardiovascular health as well. Fourth, in this era of a global pandemic, telemedicine is likely to become a norm. In that context, ECG is more suited to remote assessment37 than invasive methods like OGTT and HbA1c estimation.
Of note, the use of ECG for detection of diabetes and pre-diabetes has a strong biological rationale. The need for evaluation of cardiac status in type 2 diabetes has been long recognised.38 Diabetic cardiomyopathy is characterised by stimulation of the connective tissue growth factors, fibrosis, accumulation of AGE and overall stiffness of the heart muscle.14 39–42 This sequence of events is particularly noticeable in the basal and septal areas of the left ventricle.43 Interestingly, these changes in heart structure and function begin very early in disease and are known to occur with sustained hyperglycaemia in the prediabetic range as well.43 44 Therefore, ECG can be of value early during diabetes/pre-diabetes to detect the subtle, subclinical, concomitant and characteristic cardiac involvement. In our study, the best predicted (with highest confidence) illustrative examples from each target class showed (figure 4) that in the pre-diabetes and diabetes patients there were clearly detectable deep S waves in lead III; tall R waves in leads aVF and V2–V3; T wave abnormalities in leads V2, V3 and V5; and higher heart rate as compared with the best predicted person with ‘no diabetes’. These observations are in line with those described as biologically characteristic of diabetes without concomitant cardiac disease.43

Typical prediction offered by the DiaBeats model for each class. The panels show the 12-lead ECGs examples of highly confidently predicted samples (e, least sample-specific loss) for the no diabetes (left), pre-diabetes (middle) and type 2 diabetes (right) classes. Highlighted in light blue are the beats that were identified by the DiaBeats model to be most characteristic. avF, augmented Vector Foot; aVL, augmented Vector Left; aVR, augmented Vector Right.
Our results need to be considered in the light of the published literature on similar detection strategies for diabetes/pre-diabetes. Automation attempts for ECG annotation with respect to cardiac abnormalities, especially arrhythmias, have been aplenty45 46 but use of ECG as a predictor of diabetes in the context of ML or DL has been infrequent and very recent. Our study differs from the previous attempts in this direction in the following ways. First, previous studies have relied on the fact that heart rate variability (HRV), an indicator of autonomic regulation of the heart function, is affected in diabetes.47 While this is certainly true, the cardiac affliction in diabetes is also a result of the structural damage to myocardium.14 Our study used ECG in such way that information from both the structural and functional abnormalities could be included in training. For example, we did not explicitly extract HRV-related features (time and frequency domain) and used that as input to training as previous studies17 48–53 have done. Rather, we extracted beats and used the time-aligned features of these beats as inputs for training. This approach permitted the inclusion of both HRV-related and HRV-unrelated beat morphology to be used for model training. Second, all previous studies have focused on a sequence of heart beats rather than a single beat as a unit of analysis as used in this study. Consequently, the speed of diagnosis is greatly improved in our approach. Third, the accuracy of diabetes detection has varied in previous studies within the range of 86%–95%.17 49–53 Two recent studies in this regard are also important. The study by Porumb et al 18 did use heartbeat as the unit of analysis but was designed to detect hypoglycaemic events in the context of continuous glucose monitoring while the second study54 used DL techniques to achieve an accuracy of 77% for detection of diabetes. Our estimate of 97% accuracy in the independent test set is a further improvement as compared with the previous studies.17 18 49–54 Last few years have seen an upsurge in the concept of using ML methods to detect pre-diabetes. For example, Wang et al 20 developed the IGRNet model—an extensive DL model—to predict pre-diabetes from ECG images with high accuracy. Also, Bent et al 55 have recently published a proof of concept study to demonstrate how the wearable smartwatches can be combined with ML methods to remotely monitor HbA1c and interstitial glucose concentrations. Similarly, Zhu et al 56 have developed an impedance based DS21 tool to detect diabetes. Also, a large study (n=27 779) by Kengne et al 57 investigated the ability of 12 non-invasive risk score models to predict type 2 diabetes and found the accuracy to lie in the range 0.76–0.81. Using the rich waveform data recorded by digital ECG machines, our study was able to detect pre-diabetes with a very high accuracy both in the validation and independent test sets thereby providing a potential candidate for population-level screening. Together, our study provides an ECG-driven ML model that is fast and accurate in predicting both diabetes and pre-diabetes.
Notably, our XGBoost-based DiaBeats classifier was the best performing algorithm as compared other ML models or DL models. Algorithmically, XGBoost represents an ensemble approach based on decision-tree analytical framework. This algorithm has several advantages like hardware optimisation and speed, a parallelised tree-building process, tree pruning using a depth-first approach and, most importantly, L1 and L2 regularisation to reduce or avert overfitting. The value of this increasingly popular algorithm in clinical classification tasks is demonstrated in two recent, elegant reviews.58 59 An important observation from our analyses was the performance superiority of XGBoost over mainstream DL models (online supplemental table 1). Regardless of the depth and complexity of the DL models considered in this study XGBoost was faster and more accurate as compared with other DL models for time series classification task undertaken in this study. A similar observation has recently been reported for time series forecasting also.60 The classification superiority of XGBoost, however, should not be considered as a generalisation of its algorithmic capability in comparison to the DL models studied here. It is conceivable that the tabular representation of the preprocessed beat data, mitigation of the potential long-range time series features by clipping the ECG signals into individual heartbeats and the inherent nature of the classification problem may have made DL models somewhat redundant for this classification task. Future studies need to evaluate the formal algorithmic aspects of the ML/DL models that provide the best results for a given problem and dataset.
Our study has limitations. First, by way of design, the DISFIN study enrolled high-risk individuals and therefore the prevalence of metabolic conditions shown in table 1 cannot be considered reflective of a general population prevalence. This is important since, if the DiaBeats algorithm is to be used for screening purposes, it will likely be used in scenarios with much lower prevalence rates for diabetes and pre-diabetes than that in the DISFIN study. By (1) balancing the training dataset, (2) applying strict L2 regularisation, (3) calibration using temperature scaling and (4) then testing the predictive performance in an independent test we ensured that the DiaBeats model was as generalisable as possible. The consistency of results between the validation and test sets also points towards a strong internal validity. However, future studies need to test the predictive performance of the DiaBeats algorithm in other populations and across a range of other sampling frequencies and devices used to record ECG signals. Until such robust external validation on independent and unseen datasets is established, the results of the current study should only be considered as supportive evidence for the hypothesis. Second, 88.2% of the type 2 diabetes patients in this study were on antidiabetic medications. In the independent test set, the DiaBeats model had a comparable predictive accuracy of 96.51% (95% CI 94.27% to 98.75%) for beats from patients on medication and 89.47% (95% CI 82.57% to 96.37%) for beats from patients not on medications. These results do not appear to indicate potential confounding due to medication. However, larger studies with greater representation of patients not only on anti-diabetic but also on other important drugs (eg, antihypertensive, statins, aspirin) needs to be evaluated. From a screening point of view, however, this confounding is not very concerning since ECG analysis can be easily combined with medication history to improve screening performance. Third, this is an observational study with no data on conversion rates (from ‘no diabetes’ to pre-diabetes and from pre-diabetes to diabetes). Therefore, direct impact of early screening using ECG on these outcomes cannot be determined from our study. Fourth, in an observational study of this nature it is challenging to tease out a highly specific association of the ECG features with type 2 diabetes/pre-diabetes. In our study, there was a demonstrable gradient in the prevalence of coexisting metabolic conditions (online supplemental figure 3) with pre-diabetes and type 2 diabetes. Even though the very high value of precision of the DiaBeats algorithm are indicative of a specific association with type 2 diabetes and pre-diabetes, we conducted sensitivity analyses to examine if the presence of the comorbidities and age and gender influenced DiaBeat’s classification performance. We found (online supplemental figure 4) that age, gender and coexisting metabolic conditions did not significantly influence the classification performance as indicated by overlapping 95% CIs. Still, some concomitant extraction of features related to other coexisting metabolic conditions cannot be ruled out. Fifth, we did not have the resources to quantify cardiac fibrosis (using circulating biomarkers or contrast enhanced MRI) and therefore our interpretation of the potential of the DiaBeats algorithm to correlate with the degree of cardiac fibrosis could not be proved in this study. However, it needs to be remembered that the goal of the DiaBeats algorithm was not to diagnose cardiac fibrosis but to detect the cardiac changes (structural and functional) to aid in predicting the type 2 diabetes status. Sixth, we considered the possibility that preprocessing individual beats by taking a window of 0.8 s around the R peaks may result in trimming off of some usual features in individuals with lower heart rates. We thus also repeated the entire set of analyses using a beat window size of 1 s around the R peaks. The results (online supplemental figure 10) indicated that the classification performance of DiaBeats was better with a beat window size of 0.8 s. However, alternative approaches that account for heart rate in the choice of the window size can also be considered.
In conclusion, early detection is a cornerstone of diabetes prevention strategies, especially in high-risk populations.61 The invasive and expensive nature of OGTT and HbA1c assessments can be an impediment to large-scale screening for diabetes. In theory, our study provides a relatively inexpensive, non-invasive and accurate alternative which can be used as a gatekeeper to effectively detect diabetes and pre-diabetes early in its course. Nevertheless, adoption of this algorithm into routine practice will need robust validation on external, independent datasets.
Data availability statement
Data are available on reasonable request. The data are confidential and not publicly available. The codes and notebooks are available on reasonable request to the authors.
Ethics statements
Patient consent for publication
Ethics approval
This study was approved by the Institutional Review Board of the University of Texas Rio Grande Valley, Edinburg, Texas, USA and by the Ethics Research Committee of the Lata Medical Research Foundation, Nagpur, India. Participants gave informed consent to participate in the study before taking part.
Acknowledgments
The authors are indebted to Dr Shantanu Sengupta, Sengupta Hospital and Research Institute, Nagpur, India for the laboratory support; to Smita Puppalwar, Shilpa Pawar and Riddhi Tharani for administrative support; to Neeti Chhangani for financial management; and to Dattaraj Gondane, Harshad Sonavane and Amar Bagde for logistics during the data collection phase.
References
Supplementary materials
Supplementary Data
This web only file has been produced by the BMJ Publishing Group from an electronic file supplied by the author(s) and has not been edited for content.
press release
- Pressrelease.pdf -
press release
- Pressrelease.pdf -
Footnotes
Twitter @DrAnoopKulkarni, @dr_apatel
Contributors HK, ARK and MM conceptualised the study. AAP, KVP, SGJ and MTJ conducted the field study. VT, LG and PG recorded all the ECGs. HK and ARK conducted all the analyses. HK and MM wrote the initial draft of the manuscript. All the authors critically reviewed the manuscript and approved the final version. HK is the guarantor.
Funding This study was funded by Lata Medical Research Foundation’s internal funding mechanism.
Competing interests None declared.
Patient and public involvement Patients and/or the public were not involved in the design, or conduct, or reporting, or dissemination plans of this research.
Provenance and peer review Not commissioned; externally peer reviewed.
Supplemental material This content has been supplied by the author(s). It has not been vetted by BMJ Publishing Group Limited (BMJ) and may not have been peer-reviewed. Any opinions or recommendations discussed are solely those of the author(s) and are not endorsed by BMJ. BMJ disclaims all liability and responsibility arising from any reliance placed on the content. Where the content includes any translated material, BMJ does not warrant the accuracy and reliability of the translations (including but not limited to local regulations, clinical guidelines, terminology, drug names and drug dosages), and is not responsible for any error and/or omissions arising from translation and adaptation or otherwise.