Article Text

Abstract
Background Patient flow directly affects quality of care, access and financial performance for hospitals. Multidisciplinary discharge-focused rounds have proven to minimise avoidable delays experienced by patients near discharge. The study objective was to support discharge-focused rounds by implementing a machine-learning-based discharge prediction model using real-time electronic health record (EHR) data. We aimed to evaluate model predictive performance and impact on hospital length-of-stay.
Methods Discharge prediction models were developed from hospitalised patients on four inpatient units between April 2016 and September 2018. Unit-specific models were implemented to make individual patient predictions viewable with the EHR patient track board. Predictive performance was measured prospectively for 12 470 patients (120 780 patient-predictions) across all units. A pre/poststudy design applying interrupted time series methods was used to assess the impact of the discharge prediction model on hospital length-of-stay.
Results Prospective discharge prediction performance ranged in area under the receiver operating characteristic curve from 0.70 to 0.80 for same-day and next-day predictions; sensitivity was between 0.63 and 0.83 and specificity between 0.48 and 0.80. Elapsed length-of-stay, counts of labs and medications, mobility assessments and measures of acute kidney injury were model features providing the most predictive value. Implementing the discharge predictions resulted in a reduction in hospital length-of-stay of over 12 hours on a medicine unit (p<0.001) and telemetry unit (p=0.002), while no changes were observed for the surgery unit (p=0.190) and second medicine unit (p<0.555).
Conclusions Incorporating automated patient discharge predictions into multidisciplinary rounds can support decreases in hospital length-of-stay. Variation in execution and impact across inpatient units existed.
- assistive technology
- delivery
- medical apps
Data availability statement
No data are available. Patient-level hospital data are prohibited for sharing under both federal privacy (HIPAA) and contractual constraints. However, authors are happy to share additional methodological detail and code if requested. Please email slevin33@jhmi.edu
This is an open access article distributed in accordance with the Creative Commons Attribution Non Commercial (CC BY-NC 4.0) license, which permits others to distribute, remix, adapt, build upon this work non-commercially, and license their derivative works on different terms, provided the original work is properly cited, appropriate credit is given, any changes made indicated, and the use is non-commercial. See: http://creativecommons.org/licenses/by-nc/4.0/.
Statistics from Altmetric.com
Introduction
Patient flow is a widely scrutinised marker of hospital efficiency with research linked to patient safety, access and financial performance.1–3 Avoidable delays in-hospital expose patients to increased risk associated with hospitalisation (eg, hospital-acquired infections, adverse drug reactions, pressure ulcers)1 and degradation in patient experience.4 These same delays block patient access downstream from external admission sources (eg, transfers) and internal sources resulting in emergency department boarding,5 postanaesthesia care unit boarding6 and operating room holds.7 Each of these circumstances require patient treatment in suboptimal care areas. Challenges in hospital patient flow fall within a shifting policy environment that promote publicly reported quality measures8 and value-based incentive programs9 targeting reductions in hospital-based care spending, which exceeded $1 trillion in the USA in 2017.10 This has triggered many hospitals to focus intensive effort on improved management of capacity and patient flow.
Underlying these initiatives are operational best practices and the potential for health information technology to support and/or enable new models that minimise patient’s non-value added time in hospitals. Two connected best practices have shown promise, but variable results include real-time demand capacity (RTDC) management11 and multidisciplinary discharge-focused rounds.12–14 Both efforts target avoidance of common delays experienced by patients near discharge. RTDC management consists of a hospital-wide morning preparation huddle to predict and prioritise patients likely to be discharged that same day. Demand from new patients (expected admissions) is then matched to projected capacity (available beds) to ensure efficient patient flow at the hospital-system level.11 Discharge-focused multidisciplinary rounds function daily at the unit level to engage all patient care stakeholders in anticipation of patient discharges and to prioritise tasks required to expedite the process (eg, securing patient placement, confirming outpatient services).13 15 RTDC management and discharged-focused rounds are complementary approaches that both rely on accurate prediction of individual patient discharges.
Discharge predictions have been traditionally generated by clinician stakeholder groups as part of rounds or morning bed huddles. This manual process diverts clinician time away from direct patient care activities and has demonstrated high variability and limited predictive accuracy.16 17 This has motivated operations-focused researchers to develop automated predictions of individual discharges or discharge volume using data available in the electronic health record (EHR).17–20 These retrospective analyses have demonstrated that EHR-data-driven models can perform as well—and sometimes better—than clinician-driven predictions.17 However, to our knowledge, there have been limited published studies demonstrating translation of an automated discharge prediction model into clinical practice with analysis of impact on operational outcomes.21 The objectives of this study were to develop and deploy a machine-learning-based discharge prediction tool and evaluate its impact on hospital patient flow.
Methods
Study design and setting
This preintervention and postintervention cross-sectional study included all adult patients admitted to four hospital units (two medical, surgical and telemetry) between April 2016 and August 2019 at a community hospital in Columbia, MD. The automated discharge-predictions were implemented unit-by-unit. Thus, each unit had a prediction model parameterised for its own patients and distinct prestudy and poststudy periods. The preintervention time period included the 18 months preceding intervention and the postintervention period included up to 18 months, based on data availability at the time of the analysis; Med A (18 months), Med B (11 months), Surgery C (11 months), Telemetry D (16 months). This study was approved by the Johns Hopkins Institutional Review Board (IRB00253661).
Outcome measures
The primary outcome measure compared preintervention and postintervention was hospital length-of-stay, defined as the time-interval from when a patient was physically transferred to the hospital unit (ie, admission time) to when the patient physically exited the hospital (ie, discharge time). Measures characterising discharge predictive performance prospectively were also evaluated. These included the area under the receiver operating characteristic curve (AUC), sensitivity, specificity and accuracy of predicting same-day discharges (discharges before midnight on the same day of prediction) and next-day discharges (discharges before midnight on the day after prediction).
Predictive model development
Supervised machine learning models were developed (ie, trained) for each unit from EHR data. Models were designed to dynamically update predictions for each patient at three time-points each day. Prediction times were aligned with unit-level work processes which included morning preparation (between 06:00 and 09:00 hours), multidisciplinary rounds (between 08:00 and 11:00 hours) and evening shift change (17:00 hours).
Implementation of the predictive model in real-time guided the database structure for derivation. For example, a patient on Med Unit A that arrived at 14:00 hours on Tuesday and was discharged at 16:00 hours on Thursday would have six discharge predictions generated during their stay; one evening shift change prediction on Tuesday plus three predictions Wednesday plus two on Thursday for morning preparation and multidisciplinary rounds prior to 16:00 hours discharge. This may be visualised in online supplemental figure 1), where the example patient has six distinct discharge predictions and corresponding discharge outcomes. Actual observed outcomes for each patient-prediction were assigned positive (1) when they were discharged within the outcome time-frame and negative (0) when they were discharged after (ie, stay). Discharge outcomes included the same-day (by midnight) as the prediction (Day 0), the next day (Day 1) and the following day (Day 2).
Supplemental material
Predictor data for each patient, which primarily captures the type, density and change of clinical events over time, were used to generate discharge predictions and have been previously validated by our study team.17 18 The predictor data for each discharge prediction were extracted within a 24-hour time window prior to the prediction time. These EHR predictor data encompass demographic, administrative, temporal, medication, other interventions, diagnostics, monitoring, rehabilitation, consults, diet and more complex clinical markers (pain management, substance abuse, sepsis, cardiac arrest, acute kidney injury) as seen in table 1. A portion of these predictors were fixed (eg, age and gender), but a majority dynamically updated over time and were designed to track the density of interventions (eg, counts of new intravenous medications, supplemental oxygen), diagnostic and monitoring needs (eg, counts of labs, vital sign frequency), complexity of decision-making (eg, consult services ordered) and correlates of social and behavioural determinants (eg, substance abuse clinical marker). In addition, the total elapsed hospital and unit length-of-stay for a patient (ie, the time interval between the prediction time point and the hospital or unit admission, respectively) was used as a predictor variable to help anchor predictions. No predictor data incorporated measured values, except for a marker for acute kidney injury that relies on creatinine lab results.
Discharge prediction model variables
Separate predictive models were developed for each unit (ie, cohort), prediction-time and discharge outcome using a random forest classifier implemented within the scikit-learn Python package.22 For an individual patient, three models (same-day, next-day and following-day) yielded probabilities of discharge within the discharge outcome time frame. The set of models were joined using a previously derived formula18 to produce coherent probability distributions for each patient with an emphasis on predictions closest in time. Thresholds, derived to maximise the sum of sensitivity and specificity, were then applied to each predicted probability to identify patients likely to be discharged within a time frame. Specifically, the joint-set of predicted probabilities were scanned beginning with the same-day prediction (Day 0) to identify the earliest discharge time that had a predicted probability exceeding our preset threshold. For a common example, a patient with discharge probabilities exceeding their respective thresholds for all discharge outcomes (same-day, next-day, following-day) would be identified as a same-day discharge (Day 0) patient. Alternatively, a patient with no probabilities exceeding would be identified as a patient that was likely to be discharged beyond 3 days. This scheme enabled patient prediction output to be viewed by users as displayed in table 2 (Discharge Prediction By). All models were trained using fivefold cross-validation on a retrospective cohort for each unit. The cross validation scheme also incorporated group-based logic that randomised all patient predictions to the same fold, to avoid confounding of model performance on test folds.
Example discharge prediction output viewable in the electronic health record track board
Intervention
During the intervention period, unit-specific random forest predictive models were applied to real-time data yielding predictions at the three daily time-points for each patient present in the unit. These predictions were viewable in the Epic EHR patient track board and via automated email in the format seen in table 2. However, the primary intervention occurred during multidisciplinary rounds for each unit. The recommended standard process for use of the discharge prediction information was for the unit case manager to report prediction output (table 2, Discharge Prediction By) as an initial step in the rounding process. The other members of the rounds team (ie, physicians, nurses, physical therapists, pharmacists and social workers) would then respond to the proposed discharge targets. These discussions would lead to an agreed on projected discharge date for each patient and enabled a detailed plan for the activities and barriers that would impact discharge timing. These discussions were limited to ~2 min per patient with the agreed discharge date documented on a whiteboard visible to the entire care team. Activities required for patients closest to predicted discharge time (ie, 0 days) were prioritised.
Education of discharge-focused rounding process using predictions targeted case management, but was also provided to other stakeholders. Education comprised of presentations in case management forums regarding the recommended use, rationale and inputs and outputs of the technology. This was supplemented by 132 hours of just-in-time education and observations across units. This included gathering feedback (ie, useful predictor data) to incorporate back towards improving the predictive algorithm via a rapid iteration process.23
Evaluation
Discharge prediction performance was measured prospectively during the intervention period for each unit. Performance measures included the AUC and binary classification measures of accuracy, sensitivity and specificity are reported for same-day and next-day predictions stratified by unit. The same-day and next-day output was more readily used while the following-day predictions were not. We also performed analyses of predictor variable importance to support model interpretation.24 We evaluated the impact of the intervention on hospital length-of-stay using an interrupted time series design to control for other confounding that may have occurred over time. Time series plots and segmented regression analyses was performed to assess changes in level and trend of median hospital length-of-stay postintervention.25–28 The Durbin-Watson statistic was calculated for each time series to test for serial autocorrelation.29 Autocorrelation was not detected (p<0.100) across any segmented regression models and therefore not included in final segmented regression analyses.
Results
A total of 120 780 automated discharge predictions were made for 12 470 patients across the study units postintervention: Med A (42 500 predictions), Med B (11,279), Surgery (26,725), Telemetry (40,276). The AUC ranged from 0.70 to 0.78 for same-day and next-day predictions across units as seen in table 3. Model accuracy ranged between 0.62 and 0.71, sensitivity between 0.63 and 0.83 and specificity between 0.48 and 0.71 depending on the unit, discharge-outcome and prediction time as seen in table 3. Evening same-day predictions were not applicable because by 05:00 hours, it was known who was leaving that same day (ie, discharge orders available).
Automated discharge prediction performance measured prospectively during the interventional period
Predictor variable importance for the Medicine Unit A model at the multidisciplinary round may be seen in figure 1 as a general representation of the models deployed postintervention. Elapsed hospital and unit length-of-stay anchored these predictions as the most important predictors consistent with prior research.17 18 Counts of general lab studies, and medications administered yield the highest predictive value. Mobility scale measurements collected routinely30 and acute kidney injury stage31 were also among the most important predictors leveraged within the model.

Predictor variable importance for the medicine unit a discharge prediction model at multidisciplinary rounds (09:00 hours).
Impact analysis
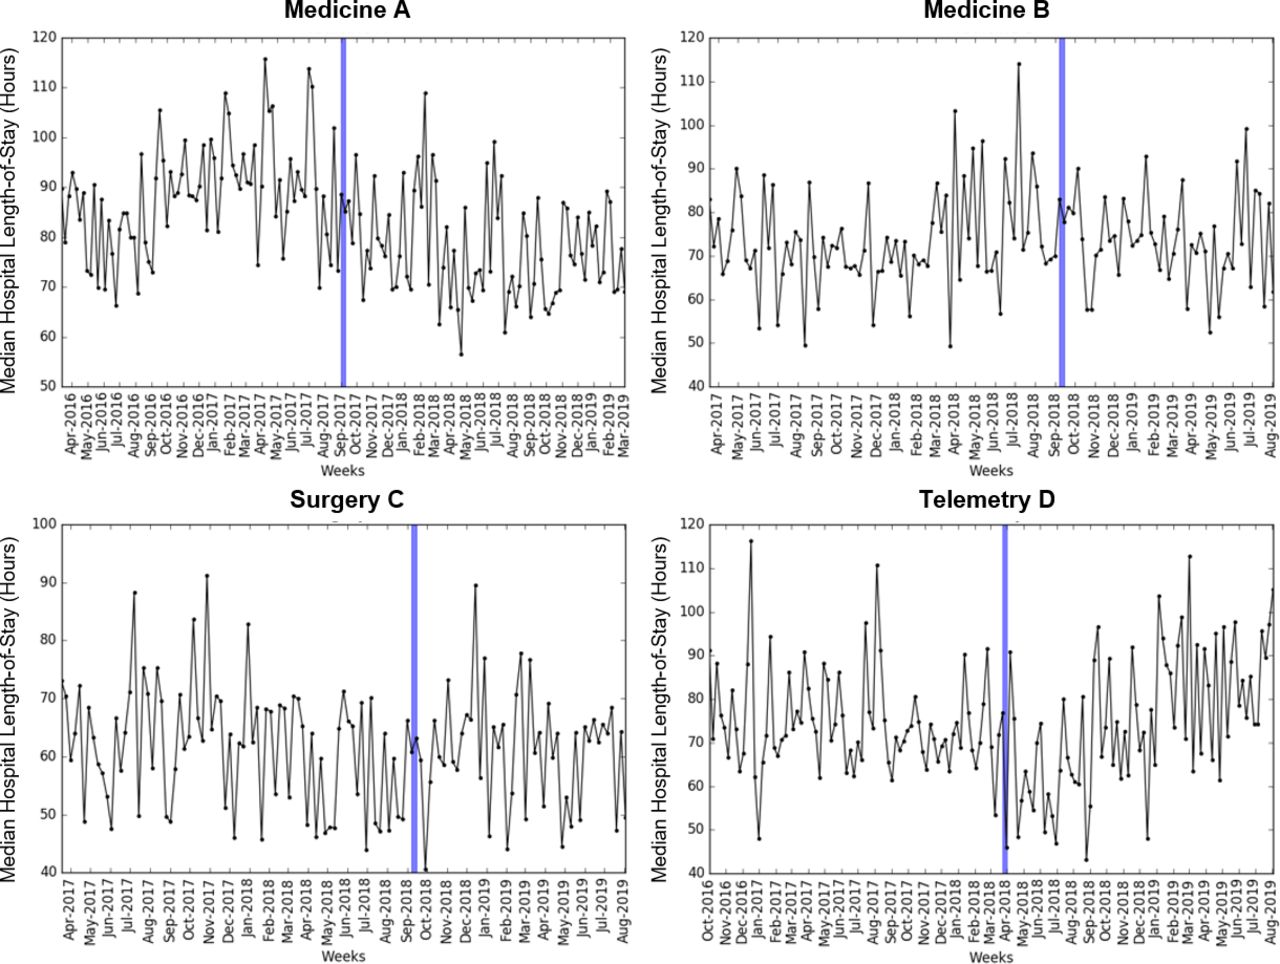
An assessment of the impact of automated discharge predictions on hospital length-of-stay by unit was performed as seen in figure 2. This included drawing time-series comparisons between 15 613 patients preintervention (3694 Med Unit A, 2945 Med Unit B, 4700 Surgical Unit and 4274 Telemetry Unit) and the 12 470 patients postintervention (4037 Med Unit A, 1716 Med Unit B, 2904 Surgical Unit and 3813 Telemetry Unit). Segmented regression analyses were used to estimate changes in both level and trend in median hospital length-of-stay postintervention as seen in table 4. The intervention resulted in an over 12 hours reduction in hospital length-of-stay for both the Medicine A (p<0.001) and Telemetry D (p=0.002) units, while there was no significant change in level or trend for the Medicine B (p<0.555) or Surgery C units (p=0.190).

Weekly median length-of-stay predischarge and postdischarge prediction intervention. The blue vertical line denotes the intervention start time for each unit.
Segmented regression analyses for the median hospital length-of-stay (18 months)
Discussion
This translational study demonstrated the development, implementation and impacts of integrating automated discharge predictions into the multidisciplinary rounding process. Applying machine learning methods to real-time EHR data, enabled discharge predictions to be continually updated for each patient on a unit. Automated morning predictions of same-day discharges yielded a sensitivity of between 0.65 and 0.73 and specificity between 0.66 to 0.71 across units. This was comparable to prior reports of clinician made same-day predictions with 0.51 and 0.66 sensitivity and 0.83 and 0.88 specificity, respectively.16 17 While the models range in sensitivity and specificity between units was evident, it was not meaningful in garnering uptake or operationally driving length-of-stay; model accuracy was not associated with length-of-stay reductions. For next-day predictions made in the morning, the comparison was similar; automated predictions had 0.78–0.83 sensitivity and 0.48–0.59 specificity compared with clinician predictions with 0.27 and 0.39 sensitivity and 0.86 and 0.88 specificity, respectively.16 17 By design, automated discharge predictions had increased sensitivity profile compared with prior reports of clinician predictions.
In practice, the automated discharge predictions were designed to drive a standard discharge-focused rounding process, already proven effective in reducing patients’ hospital length-of-stay.12–14 This measurably reduced hospital length-of-stay postintervention in half (2–4) of the units studied. Through direct observation, we saw significant variation in multidisciplinary rounding processes by unit. The stakeholders present during rounding was varied including absence of physicians and lack of consistency in case management staff due to staffing difficulties (ie, high turnover). Further, there were variations in the team’s ability to document (ie, whiteboard) an agreed on discharge date and evaluate patients prior to rounds based on temporal patterns in shift-changes and hand-offs.
Overall, multidisciplinary rounds were most effective when there was a clear leader that used the automated predictions within a standard workflow that included use of a white board for communication (eg, documentation of the target discharge date up-front, plan of care), time limits for individual patient discussion, identification of key tasks/barriers required to meet discharge expectations and clarity in the purpose of discussion (eg, discharge focused versus clinical) aligned with prior study findings.12–14 While we strived to achieve uniformity in the implementation and sustainment of the programme, variation did exist. Teams able to drive action on prioritised tasks immediately following rounds, including communicating clear requests to ancillary departments and the patients and families, were most successful in consistently reducing length-of-stay. Additional communication and coordination mechanisms (eg, discharge barrier checklists) which were not used in our study could likely support uniformity. It is ideal that these coordination tools are part of the EHR. In addition, we recommend that an automated discharge technology be implemented house-wide (ie, all units) such that training and rounding standards are set and monitored with all stakeholder input.
Limitations
There were several limitations of this study. First, measurement of the impact on hospital length-of-stay was evaluated using a quasiexperimental design (eg, preintervention and postintervention) which may be susceptible to confounding. Many factors can drive length-of-stay, but because this was a hospital system-wide quality improvement intervention, a randomised trial was not appropriate or feasible. No major interventions hypothesised to influence length-of-stay occurred during the study period. There was also no other comparable medical or surgical units without the intervention over the same period to draw comparisons to. Given the inherent limitation of the quasiexperimental design, large sample sizes, multiple study units and use of segmented regression analyses were all means of mitigating potential confounding. Next, although automated predictions were applied in multiple separately functioning hospital units, these units were within a single hospital limiting generalisation. However, the findings regarding discharge predictions and multidisciplinary rounding processes were aligned with several prior studies.12 13 16 17 Another limitation was that preintervention and postintervention data were not collected over the same time period across all units because of the stepwise roll-out process (ie, individual unit-by-unit implementation). We selected an 18-month interventional time window (if available) for each unit to maximise sample size and provide the most robust premeasurement and postmeasurement estimates using available data. A final limitation was that predictive models were periodically updated based on current data or new findings from observations during the postintervention period. Regardless of updating, all predictive performance measures were collected prospectively out-of-sample (table 3) and the model characteristics displayed in table 1 and figure 1 reflect the final model used at the end of the postintervention period.
Conclusion
As hospitals strive to increase operational efficiency and remove bottlenecks in patient flow, data-driven technologies may play an important supporting role. Incorporating automated, data-driven, discharge predictions into multidisciplinary rounds can support improvements in patient flow. Automated discharge predictions had predictive performance comparable to prior reports of clinician generated predictions. This original translational study demonstrated that an automated discharge prediction intervention can provide utility in driving reductions in hospital length-of-stay. However, unit-level variation existed underscoring the importance of implementation and consideration of human factors in realising consistent hospital-wide benefit.
Data availability statement
No data are available. Patient-level hospital data are prohibited for sharing under both federal privacy (HIPAA) and contractual constraints. However, authors are happy to share additional methodological detail and code if requested. Please email slevin33@jhmi.edu
References
Supplementary materials
Supplementary Data
This web only file has been produced by the BMJ Publishing Group from an electronic file supplied by the author(s) and has not been edited for content.
Footnotes
Contributors SL, SB and JH planned the study. MT, ArD, AnD, SB and SL developed the technical components of the technology and performing data analyses. EHa led technology implementation and implementation-focused writing. JH, EHoy, TD, EHow performed clinical interpretation for model development, results evaluation and critically revised the manuscript. EHow also performed a non-conflicted review of the data and manuscript.
Funding The technology development and assessment was supported by the United States National Science Foundation (NSF) Award #0927207, SBIR 1621899 and SBIR 1738440 to StoCastic LLC, with a subaward to The Johns Hopkins University School of Medicine. SL, SB, ArD, AnD and EHa received funding from this award.
Competing interests The technology described in this manuscript was developed and implemented by StoCastic LLC. Under a license agreement between StoCastic and the Johns Hopkins University, Dr Levin and the University are entitled to royalty distributions related to technology described in this publication. SL is a founder of StoCastic and he, JH, EHa, AnD, MT and the University own equity in the company. This arrangement has been reviewed and approved by the Johns Hopkins University in accordance with its conflict of interest policies. A patent (US9311449B2) for the discharge prediction tool has been issued by Johns Hopkins University. Rights for commercial development of this intellectual property (IP) have been exclusively licensed by StoCastic, LLC.
Provenance and peer review Not commissioned; externally peer reviewed.